


The Revenue Operations Blueprint: Real Templates and Automations for Growing Teams
Related articles

Posted on: October 3, 2025
The Connected GTM Stack Playbook

Posted on: September 8, 2025
Salesforce Security Review: Field-Level Security & Auditing (Field Notes for Intermediate Admins)

Posted on: September 3, 2025
Top 10 Tips for Salesforce Administrators
Posted on: September 2, 2025
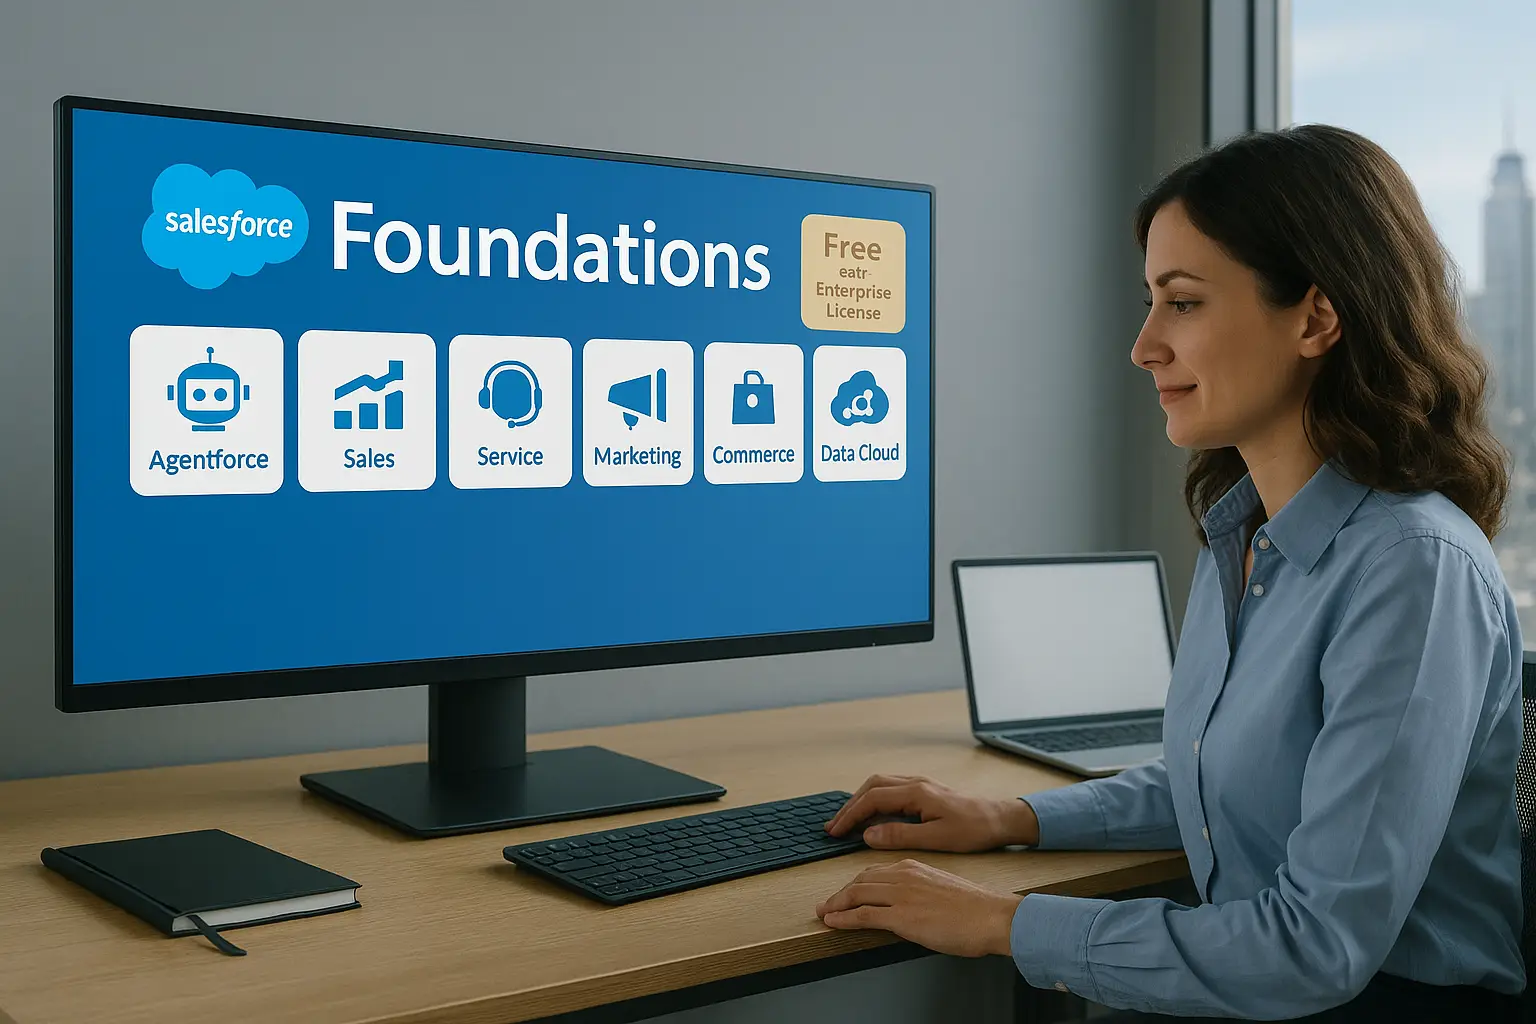
Salesforce Foundations: Free, Fast Wins Hiding in Your Enterprise License

Posted on: August 26, 2025
10 High-Impact Updates Every Salesforce Admin Should Make (This Quarter)

Posted on: August 19, 2025